A SaaS dashboard is a centralized hub that helps teams track subscription performance, revenue trends, and customer activity using real-time data.
Most SaaS companies rely on two core dashboards:
- Billing Dashboard
- Product Dashboard
Billing Dashboard
The billing dashboard tracks financial performance across revenue, collections, failed payments, revenue recognition, and reporting.
Revenue Metrics
These metrics are used to measure the predictable subscription income and the overall quality of revenue.
Annual Recurring Revenue (ARR)
Annual Recurring Revenue is commonly known as ARR. It is one of the key financial aspects for subscription-based businesses, mainly SaaS companies. No matter if you’re a startup founder, investor, or business enthusiast, having an idea about ARR provides you clarity on several aspects. This consists of growth potential, revenue health, & long-term sustainability.
Here, we’ll explore what ARR is, why it’s important, & how to evaluate it. Moreover, this also covers best practices for improving ARR.
What is ARR?
Annual Recurring Revenue (ARR) refers to the predictable and recurring income a business can expect from its existing subscriptions. It focuses on recurring revenue (not one-time payments). ARR is mainly used to measure the stability and scalability of subscription-based businesses
Why ARR Matters?
ARR is well-known among subscription businesses for several reasons:
Predictability
ARR helps businesses to predict revenue more accurately by focusing on recurring contracts. Predictable income means better budget planning & resource allocation.
Business Health Metric
Investors and leaders use ARR as a key performance indicator (KPI). Strong ARR growth shows that your product is in demand. Not only this, but it also indicates that the customers are continuously using it.
Benchmarking Growth
ARR helps companies measure growth over time on a monthly or yearly basis. This helps plan product, marketing, or team expansions.
Performance Incentive
Teams often use ARR to set performance goals and compensation targets. This is because it links directly to revenue growth.
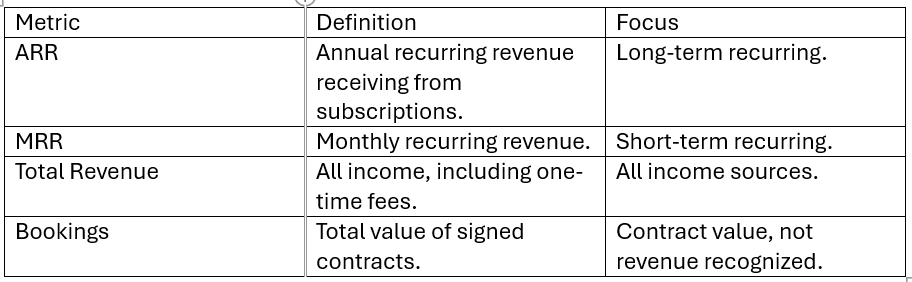
ARR vs. Other Revenue Metrics
How to Calculate ARR?
The basic formula is:
ARR = (Total Annual Subscription Value) – (Discounts & Refunds)
For example,
If your company has:
100 customers paying $1,000 per year each.
$20,000 in annual discounts
Then:
ARR = ($1,000 × 100) – $20,000
ARR = $100,000 – $20,000
ARR = $80,000
Thus, your business expects $80,000 in guaranteed recurring revenue this year.
Key Elements in ARR
The core factors that play a key role in ARR are:
Subscription Renewals
Contracts renewed year after year get added directly to ARR.
Upsells and Expansions
If current clients upgrade their plans, the increased recurring revenue contributes to ARR.
New Subscriptions
New customers signing recurring contracts improves ARR.
Core Factors that Affect ARR Growth
Growing ARR is not accidental; it includes careful strategy.
Key factors include:
Customer Acquisition
The faster you gain new subscribers, the higher your ARR grows.
Retention & Churn
Retaining customers ensures recurring revenue. If a greater number of customers are leaving, then it leads to reduced ARR growth.
Upselling & Expansion
Selling higher-tier plans or additional features increases customer value and ARR.
Product Value & Market Fit
A product that solves customer needs improves retention and referral revenue.
Strategies to Improve ARR
When it comes to ARR, here are some proven ways to improve it without much hassle:
Reduce the Number of Customer Losses
Improve customer support, onboarding, and product satisfaction.
Improve Upselling Opportunities
Offer tiered plans with optional add-ons and premium features.
Optimize Pricing
Review pricing regularly and adjust as per the market demands.
Focus on Customer Success
Help customers understand value quickly and improve renewals.
Extend Contract Terms
Provide incentives for annual contracts monthly. Annual deals directly increase ARR.
Monthly Recurring Revenue (MRR)
MRR (Monthly Recurring Revenue) is one of the most important metrics for SaaS, subscription, & membership-based businesses. This metric gives a clear idea about predictable revenue. It also helps you know how well business is growing.
What is MRR?
Monthly Recurring Revenue (MRR) is the predictable monthly income a company receives from its subscribed customers. It focuses only on the recurring, ongoing income that comes from the clients who are paying regularly (monthly).
Why is MRR Important?
MRR is not just a number. It offers business leaders with valuable insights into their company's financial health, growth momentum, and future planning.
Here’s why MRR is important:
Predictable Revenue Forecasting
MRR makes financial planning and budgeting process easy.
Performance Tracking
It helps monitor growth trends over time.
Investor Attraction
Stakeholders often look at MRR to understand business stability.
Benchmarking
It is used for comparing performance month-over-month
Key Components of MRR
1. New MRR – Revenue gained from new customers in a given month.
2. Expansion MRR – Revenue received from existing customers upgrading or purchasing add-ons.
3. Churned MRR – Revenue lost from clients who cancel or downgrade their subscriptions.
4. Net New MRR – The total change in MRR once new, expansion, & churned revenue are considered
How to Calculate MRR
The basic formula for calculating MRR is:
MRR = total count of paying customers × average revenue per user (ARPU).
For example.
If you have 50 customers paying $40 per month, then
MRR = 50 x $40 = $2,000
More detailed MRR tracking will factor in several processes. This includes upgrades, downgrades, or cancellations.
MRR vs ARR (Annual Recurring Revenue)
MRR tracks income monthly, while ARR reflects annual revenue.
Simply, MRR x 12 = ARR.
With this, ARR becomes useful for long-term forecasting. However, MRR gives a more detailed month-to-month view.
MRR is a vital metric for subscription-based businesses that require clarity, predictability, & growth insight. Tracking MRR helps companies improve their financial planning. Not only this, but this also helps in understanding customer behavior & making smarter tactical decisions.
No matter whether you’re a startup founder or a business analyst, knowing MRR is vital. It is the key factor for recurring revenue success.
Expansion MRR
Expansion MRR is the additional monthly recurring revenue generated from current accounts through plan upgrades, increased usage, or the purchase of add-on features
Most SaaS growth does not come from acquisition alone. Sustainable growth comes from increasing revenue within your existing customer base.
While expansion revenue refers to the total growth generated from existing customers, expansion MRR specifically measures that growth on a monthly basis. It shows whether your customer base is steadily increasing its recurring spend over time.
Why Expansion MRR Matters in a SaaS Dashboard
Expansion MRR shows whether revenue growth comes from existing accounts or from new customers.
It helps teams:
- Improve revenue quality by generating growth without additional acquisition costs.
- Increase customer lifetime value (LTV) as accounts upgrades and expand.
- Strengthen Net Revenue Retention (NRR) when expansion offsets churn and contraction.
- Identify high-value segments that consistently increase their subscription spending.
When tracked alongside churn and contraction revenue, expansion MRR provides a clear view of account-level revenue movement and long-term revenue stability.
How to Measure Expansion MRR
A structured SaaS dashboard should calculate Expansion MRR accurately and separate the drivers behind it.
Expansion MRR Formula
Expansion MRR = (Upsell MRR + Cross-sell MRR + Reactivation MRR) – Revenue Lost from Downgrades.
For example,
If MRR increases from $10,000 to $12,000 due to upgrades and add-ons,
Expansion MRR = $2,000
To understand what contributes to Expansion MRR, your dashboard should break revenue growth into specific expansion components. This helps you see exactly where the increase comes from.
Strategies to Improve Expansion MRR
Expansion grows when customers continue to see value in your product. The goal isn’t to push upgrades but to make growth feel like a natural step.
Here are practical ways to support it.
- Monitor how customers use your product and suggest upgrades when their usage increases.
- Group features around real use cases so expansion feels logical, not forced.
- Align pricing with usage or team size, so revenue grows as customers grow.
- Reconnect with inactive accounts with updates or improvements that match their needs.
- Review expansion trends regularly to see which accounts are increasing their spending and why.
Consistent review of these patterns helps teams understand what drives expansion instead of relying on generic upsell efforts.
Expansion MRR shows why the customers are choosing to spend more on your product. It shows whether growth comes from customers who are already using your product, not just from bringing in new ones.
Contraction MRR
Contraction MRR is the decrease in monthly recurring revenue when existing customers downgrade their plans, reduce usage, or cancel their subscriptions.
Unlike churn, which tracks customers who leave completely, Contraction MRR also includes revenue lost from customers who remain but switch to lower-priced plans.
This makes Contraction MRR an important indicator of revenue health.
Why Contraction MRR Matters
Contraction MRR shows how much revenue is decreasing from current customer accounts. It shows revenue lost from existing customers, even if new sales are increasing.
Here is why Contraction MRR is important:
Shows Revenue Decline Clearly
It highlights how much monthly income is decreasing from existing accounts.
Reveals Downgrade Patterns
When customers reduce their plans before canceling, it can signal dissatisfaction or changing needs.
Supports Better Pricing Decisions
Frequent downgrades could suggest a misalignment between pricing tiers and customer expectations.
Helps Improve Retention
Understanding why customers reduce their spending helps take corrective actions early.
If Contraction MRR keeps increasing, it becomes more challenging to grow overall revenue.
How to Measure Contraction MRR
A SaaS dashboard should calculate Contraction MRR clearly and separate the sources of revenue decline.
Contraction MRR Formula
Contraction MRR = Downgrade MRR + Cancellation MRR
For example,
If two customers downgrade and reduce their monthly spend by $400 each, and one customer cancels a $700 subscription,
Contraction MRR = $400 + $400 + $700 = $1,500
This means $1,500 of recurring revenue has decreased during that period.
Breaking this data into downgrade and cancellation components helps you understand where revenue reduction occurs.
How to Reduce Contraction MRR
Reducing Contraction MRR is not only about stopping cancellations. It is about understanding why customers reduce their spending.
Here are some effective strategies to reduce it.
Monitor Usage Trends
Track customer activity. If usage drops, take action before the downgrade happens.
Collect Feedback
Ask customers why they changed their plans. Their responses provide useful insights.
Improve Onboarding
Better onboarding helps customers understand the full product value.
Adjust Pricing Plans
If many customers move to lower tiers, review your plan structure.
Strengthen Customer Support
Quick and helpful support improves satisfaction and reduces plan reductions
Contraction MRR shows how much recurring revenue is decreasing from existing customers. It reveals when and why the subscription value drops over time.
When tracked alongside Expansion MRR and churn, it gives a clearer picture of the overall revenue movement. Reviewing these metrics regularly helps you keep revenue steady.
Net Revenue Retention (NRR)
Net revenue retention (NRR) is one of the most important metrics for subscription & SaaS businesses. With this metric, you can measure how much recurring revenue a firm retains from its current customers in a specific time. This includes revenue gained from upgrades or increased usage, & loss in revenue because of downgrades or cancellations.
In simple terms, what is NRR? It shows whether the revenue generated from current customers is growing, shrinking, or staying the same. A high net retention rate indicates client satisfaction, product value & long-term growth potential.
For example, imagine a company starting with $100,000 in recurring revenue from current clients and ending the period with $110,000 from the same clients. In this case, its NRR is 110%. An NRR above 100% is considered a strong benchmark for SaaS companies, signaling that expansion revenue outpaces churn and downgrades.
Here is the standard net revenue retention formula used by SaaS finance teams and investors.
NRR = (Starting Recurring Revenue + Expansion Revenue – Churn – Downgrades) ÷ Starting Recurring Revenue x 100
In this formula, four key components are included: The components are:
- Starting recurring revenue from existing customers.
- Expansion revenue from upgrades, add-ons, or increased usage.
- Revenue lost due to customer loss.
- Revenue lost due to downgrades.
Why Net Revenue Retention Matters for SaaS
When it comes to SaaS & subscription businesses, getting new customers is difficult. This is why improving the net retention rate for existing customers is essential.
A strong NRR showcases that clients are continuously finding value in the product & increasing their usage. Companies with high NRR often rely on certain strategies. This includes usage-based billing, upselling & product expansion to grow revenue within their current client base.
NRR also plays a major role in churn management. If churn increases, the metric quickly declines. Monitoring this metric helps businesses identify retention issues early.
In addition, Saaslogic's subscription analytics dashboard gives finance teams a real-time view of NRR, expansion MRR, and churn trends. Thus, enabling better visibility into revenue performance. This, as a result, helps you take proactive steps to reduce churn.
Average Revenue Per Account (ARPA)
ARPA shows how much revenue each customer account generates on average, making it one of the most practical metrics in a SaaS dashboard. While total revenue shows overall growth, ARPA reveals the strength of revenue at the account level. It helps in spotting upsell opportunities, pricing gaps, and revenue concentration risks.
ARPA differs from ARPU, which focuses on individual users rather than accounts. These metrics play an important role in a SaaS dashboard because they connect pricing, retention, and expansion into a single, measurable revenue indicator.
ARPA Formula and Calculation
You can calculate ARPA monthly or annually, depending on how you track revenue.
Monthly ARPA
ARPA = Total Monthly Recurring Revenue (MRR) ÷ Number of Active Accounts.
Annual ARPA
ARPA = Annual Recurring Revenue (ARR) ÷ Number of Active Accounts.
For instance, if your SaaS business has an MRR of $100,000 and 1,000 active accounts, the ARPA calculation would be:
ARPA = 100,000 ÷ 1,000 = $100
For an accurate ARPA calculation, include only active, paying customer accounts, and exclude free trials, freemium users, and canceled or churned subscriptions.
Why ARPA Matters in SaaS Dashboard
ARPA shows more than just the average revenue figure. It reflects how effectively a SaaS business generates value from each customer account. While total revenue shows overall growth, ARPA highlights the strength and monetization quality of individual accounts.
When teams track ARPA consistently, they gain insight into important strategic questions:
- Are customers upgrading to higher pricing tiers?
- Does pricing align with the value delivered?
- Are enterprise accounts driving meaningful growth?
- Does revenue depend too heavily on a small number of high-paying clients?
ARPA is more insightful when considered alongside other essential SaaS metrics, MRR, ARR, churn rate, expansion and contraction revenue, and Net Revenue Retention (NRR).
A steady increase in ARPA usually indicates successful upselling, improved pricing strategy, and deeper product adoption. However, a decline may point to downgrades, pricing pressure, or attracting lower-value customers
How to Improve ARPA
Companies increase ARPA by
- Encouraging customers to upgrade their plans
- Offering additional features
- Refining pricing structures
- Attracting higher-value segments
- Retaining strong-paying accounts.
A SaaS dashboard that tracks ARPA over time makes it easier to see which actions lead to steady revenue growth.
Total Contract Value (TCV)
Total Contract Value is the total amount of revenue a company expects to earn from a customer contract over its entire duration. It includes all recurring subscription payments and any one-time charges, such as setup or onboarding fees.
TCV includes only what is written in the contract, not just the monthly amount
Why TCV Matters in a SaaS Dashboard
A SaaS dashboard uses TCV to measure deal size and long-term revenue commitments.
TCV helps teams:
- Evaluate the total value of each contract.
- Compare deal sizes across customer segments.
- Forecast committed revenue from signed agreements.
- Assess sales performance beyond monthly recurring revenue.
For companies that close annual or multi-year agreements, TCV gives clarity on the total revenue secured at the time of signing
Customer Cost and Value Metrics
These metrics measure profitability and growth efficiency
Customer Acquisition Cost (CAC)
Customer Acquisition Cost represents the total spending required to bring in one new customer. It includes sales salaries, advertising spend, commissions, marketing tools, and campaign costs linked to acquiring new customers. CAC shows how much you spend to generate revenue. It helps measure sales efficiency and customer profitability.
How to Calculate Customer Acquisition Cost
The formula to calculate CAC is
CAC = Total Sales and Marketing Costs ÷ Number of New Customers Acquired
for example,
if a company spends $80,000 in a quarter and gains 160 customers.
CAC = $80,000 ÷ 160 CAC = $500 per customer.
For an accurate CAC calculation, include all acquisition expenses. Omitting salaries or software costs understates the true cost per customer.
Customer Lifetime Value (CLV)
Customer Lifetime Value (CLV) measures the total revenue a company earns from a customer during their entire relationship. Teams use CLV to determine how much they can afford to spend on acquiring and retaining customers.
How to Calculate CLV
To calculate Customer Lifetime Value, you first measure how much revenue a customer generates in a given period. In SaaS, this usually starts with Average Revenue Per Account (ARPA).
Next, estimate how long a customer stays with your product. This can be measured in months or years.
Then apply the formula:
CLV = ARPA × Average Customer Lifespan
Some SaaS companies use churn rate to estimate lifespan:
CLV = (ARPA × Gross Margin) ÷ Churn Rate
Both approaches aim to answer the same question: how much revenue one customer generates before leaving.
Why CLV Matters in a SaaS Dashboard
Once calculated, CLV shows the long-term revenue value of each customer. A SaaS dashboard uses this number to guide growth decisions.
Compare CLV with Customer Acquisition Cost. If customers generate more revenue than it costs to acquire them, growth remains profitable. If not, the business must improve retention or increase customer value before investing more in acquisition.
Tracking CLV over time also helps teams see whether product usage, retention, and expansion efforts are increasing overall customer value.
How to Increase Customer Lifetime Value
- Reduce churn with strong onboarding and proactive support.
- Use smart dunning systems to recover failed payments.
- Upsell and cross-sell features that match customer needs
- Build product features that increase daily usage.
- Personalize offers to raise average account revenue.
These actions increase customer lifespan and total revenue.
Track CLV by cohort and segment in your SaaS dashboard. Monitor trends and improve retention, usage, and expansion to increase long-term revenue.
Churn and Retention Metrics
These metrics show revenue stability and customer retention health.
Revenue churn
Revenue churn shows how much recurring revenue a business loses during a given period. In SaaS businesses, this generally appears as a drop in Monthly Recurring Revenue or Annual Recurring Revenue.
Revenue churn calculates the loss of recurring revenue caused by customer cancellations or downgrades, while customer churn tracks the total number of customers who exit the service. Because of this, the loss of one high-value account can reduce revenue more significantly than several smaller customers leaving.
How to Calculate Revenue Churn?
Revenue Churn Rate = (Revenue Lost During the Period ÷ Revenue at the Start of the Period) × 100
Example:
Starting MRR = $100,000
Revenue lost from cancellations and downgrades = $5,000
Revenue Churn = $5,000 ÷ $100,000 = 5%.
This percentage shows how much recurring revenue was lost during the period. SaaS dashboards usually track revenue churn monthly to identify revenue decline early.
Why Does Revenue Churn Matter in a SaaS Dashboard?
Revenue churn reveals how much revenue disappears from your customer base. A business can gain new customers while still losing revenue if existing customers downgrade or cancel high-value subscriptions.
Tracking revenue churn alongside metrics such as expansion revenue and net revenue retention helps teams understand whether the product is increasing or losing value among current users.
Lower revenue churn helps keep customers longer, makes revenue more predictable, and allows the business to grow more steadily.
How to Reduce Revenue Churn?
Companies reduce revenue churn by strengthening customer value and retention.
Practical strategies include:
- Strengthen onboarding to help customers understand the product faster and start getting value from it right away.
- Monitor product usage to detect early signs of churn, which refers to the loss of customers or subscribers over time.
- Offer upgrades or add-ons that increase product adoption.
- Provide proactive customer success support.
These actions help maintain recurring revenue and extend customer relationships.
Customer churn rate
Customer churn rate is the percentage of customers who cancel or do not renew their subscription within a certain timeperiod. It explains the question, "What is churn?" in a SaaS business.
This metric is crucial for SaaS companies, influencing both revenue consistency and expansion. A rising churn rate often shows product dissatisfaction, poor onboarding, pricing issues, and a lack of customer engagement.
For companies that rely on recurring revenue management, controlling churn is essential. When customers leave frequently, recurring revenue becomes difficult to predict.
Regularly tracking churn helps SaaS companies identify retention problems early and improve customer experience.
How to Calculate Customer Churn Rate?
The formula to calculate it is:
Customer Churn Rate = (Number of Customers Lost ÷ Customers at the Start of the Period) × 100.
for example,
Customers at the beginning of the month = 500.
Customers lost during the month = 15.
Customer Churn Rate = 15 ÷ 500 × 100 = 3%
This means 3% of customers canceled their subscriptions that month.
SaaS companies usually track churn monthly or annually to understand customer retention trends. When measuring churn, count only the customers who were present at the start of the period.
Why Customer Churn Rate Matters in a SaaS Dashboard
Customer churn rate tracks customer loss within a defined period. A high churn rate can slows growth.
Monitoring churn helps teams:
- Identify problems with product experience.
- Understand customer retention trends
- Evaluate onboarding and support effectiveness.
- Improve long-term recurring revenue performance.
When churn stays low, customers remain longer and revenue becomes more stable.
How can we reduce customer churn?
Reducing churn is an important part of churn management. Businesses need to improve customer experience and increase the value customers receive from the product.
Many SaaS (Software as a Service) companies also rely on subscription billing software to track renewals and payment failures, which helps them manage recurring revenue more effectively.
Common strategies often include the following:
- Improve onboarding so customers quickly understand how to use the product.
- Track product usage to identify inactive or at-risk customers.
- Provide proactive support before customers face major issues.
- Use customer feedback to guide product improvements.
These actions help retain customers and protect recurring revenue.
Gross Revenue Retention (GRR)
For SaaS businesses, revenue usually comes from subscriptions that repeat every month or year. Because of this model, it is important to know how much revenue is retained from existing customers.
Gross revenue retention (GRR) helps measure this. It shows the percentage of recurring revenue a company keeps from its current customers after accounting for cancellations and plan downgrades
How to Calculate Gross Revenue Retention
The gross revenue retention formula focuses only on revenue that remains from existing customers. It does not include expansion revenue such as upgrades, add-ons, or cross-selling.
The formula is:
GRR = (Beginning MRR − Churned MRR − Downgraded MRR) ÷ Beginning MRR × 100.
for example,
Initial MRR: $20,000.
Revenue lost from churn and downgrades: $2,000.
GRR= 90%
This means the company kept 90% of the recurring revenue it started the period with.
Why GRR Matters in a SaaS Dashboard
GRR helps teams understand how stable their recurring revenue is. When the number is high, it usually means the company is losing very little revenue from existing customers.
Monitoring this metric also helps teams detect retention issues early. If GRR begins to decline due to cancellations or downgrades, teams can investigate the cause and take action.
For this reason, GRR is often tracked in SaaS dashboards alongside other metrics to monitor revenue stability and customer retention over time. Many SaaS companies also use recurring billing software to track subscription activity and manage recurring revenue.
Payment and Collections Metrics
These metrics show how efficiently teams collect revenue
Invoice Collection Rate
The Invoice collection rate shows the percentage of invoices a business successfully collects within a given period. It reflects how well the company manages invoicing and payment collection. When customers delay payments or leave invoices unpaid, cash flow becomes less predictable.
For SaaS businesses, consistent payments are essential because revenue usually comes from subscriptions. Monitoring the invoice collection rate helps ensure that subscription payments are collected on time and the revenue remains stable
How to Calculate Invoice Collection Rate?
The calculation is straightforward.
Invoice Collection Rate = (Invoices Collected ÷ Total Invoices Issued) × 100.
for example,
Total invoices issued: 200.
Invoices collected: 190.
Invoice Collection Rate = 95%
This means 95% of the issued invoices were paid during the period.
Why Invoice Collection Rate Matters
The invoice collection rate is important because it shows how effectively a business collects payments from the invoices it issues. This metric helps companies understand whether their billing and payment processes are working properly and if invoices are paid on time.
A high invoice collection rate usually means:
- Customers pay invoices on time
- Billing systems work efficiently
- The company maintains steady cash flow
A low collection rate may indicate:
- Payment delays
- Invoicing errors
- Weak follow-up on overdue invoices
Many companies improve collection performance by using subscription billing software and accounts receivable automation tools.
These systems help teams:
- Track unpaid invoices
- Send payment reminders automatically
- Manage collections more efficiently
As part of broader SaaS (Software as a Service) metrics, the invoice collection rate provides useful insight into billing performance and cash flow health. Tracking this metric helps businesses strengthen their invoice management process and maintain consistent revenue.
Invoice Aging
Invoice aging is a key financial metric in subscription management. It helps businesses track outstanding payments and manage cash flow efficiently through accounts receivable aging and overdue invoice tracking.
In simple terms, invoice aging means collecting unpaid invoices based on how long they have been pending. This analysis plays a key role in subscription companies that deal with recurring revenue. In addition to this, invoice aging is also crucial for companies that have a large customer base. This is because in companies with large customer base, overdue invoice tracking helps finance teams monitor delayed payments more effectively.
What is Invoice Aging?
Invoice aging is a process, which will help you track unpaid invoices over specific times. This typically includes 0–30 days, 31–60 days, 61–90 days, and 90+ days. By sorting invoices into these time periods, subscription businesses can easily track which customers have not paid. Not only this, but it will also help you to track how late those payments are. The result is an aging report which shows the accounts receivable based on aging stages.
Why Invoice Aging is Important in Subscription Management
When it comes to subscription businesses, stable cash flow is crucial for sustainable growth. Since customers are billed periodically (monthly, quarterly, and annually), delayed payments can interrupt revenue forecasting & operational planning. Many companies rely on subscription billing software and recurring revenue management platforms to manage billing cycles and maintain financial stability.
With an invoice aging report supported by accounts receivable automation, finance teams can:
- Monitor unpaid subscriptions and delayed renewals.
- Identify customers who may leave because of late payments, including those showing churn risk from payment failure.
- Decide which payments to collect first based on how late they are.
- Improve cash flow prediction with real-time insights from recurring revenue management tools.
Structure of an Invoice Aging Report
Usually, an invoice aging report is divided into categories. These categories showcase the number of days an invoice is overdue. When it comes to this report, the most common structure is:
Current (0–30 days): Invoices are still within payment terms.
- 30–60 Days: Slightly overdue payments.
- 60–90 Days: Moderately overdue invoices.
- 90+ Days: High-risk late payments.
With this structure, subscription managers can understand where cash flow gaps are forming and take necessary action.
Invoice aging is not only about tracking payments. It also helps subscription businesses stay financially strong. By regularly analyzing aging reports, subscription businesses can optimize revenue collection & reduce financial risks. Thus, improving customer relationships.
Failed Payment Rate
Failed payment rate represents the share of payment attempts that do not go through during the reporting period. Payments may fail for several reasons, including declined cards, expired payment details, or insufficient funds.
For SaaS businesses that depend on recurring subscriptions, payment failures can interrupt revenue collection. If payments continue to fail, the subscription may be canceled automatically, leading to involuntary churn.
Tracking the rate of failed payments allows teams to spot problems quickly, enabling them to take action and steps to improve payment success.
How to Calculate Failed Payment Rate
The formula is :
Failed Payment Rate = (Failed Payment Attempts ÷ Total Payment Attempts) × 100
for example:
Total payment attempts = 2,500
Failed payment attempts =175
Failed Payment Rate: 7%
This indicates that, during the specified timeframe, 7% of all payment attempts were unsuccessful.
Why Failed Payment Rate Matters in a SaaS Dashboard
The failed payment rate shows how frequently subscription payments fail. A higher rate suggests problems with payment methods, billing systems, or customer payment details.
A high failed payment rate can lead to:
- Lost revenue when payments cannot be completed successfully.
- Involuntary churn when subscriptions stop because customer payment methods fail.
- More work for teams to retry payments and ask customers to update their payment details.
SaaS teams track this metric in their dashboards to identify payment problems early and prevent disruptions to subscription revenue.
When payment failures increase, teams often use subscription billing management systems to manage and recover failed payments. These platforms track payment activity and support dunning, which automatically retries failed payments and prompts customers to update their payment methods.
Teams also review the failed payment rate alongside other SaaS metrics to better understand payment performance and improve the reliability of their billing process.
Payment Recovery Rate
The payment recovery rate measures the percentage of failed payments that a business manages to recover over a set period. It is a key indicator of how effectively a company can regain revenue that was lost due to payment problems.
In SaaS, payments often fail because of low account balance, expired cards, or temporary processing errors. Instead of losing that revenue, teams attempt to retry payments or ask customers to update their payment information. Monitoring these metrics helps teams evaluate the success of their efforts.
Here is the formula to calculate the payment recovery rate:
The formula to calculate it is simple.
Payment Recovery Rate = (Recovered Payments ÷ Total Failed Payments) × 100
For example,
Failed payments: =100.
Payments successfully recovered =65.
Payment Recovery Rate = 65%.
65% of its failed payments are recovered during that period.
Why Payment Recovery Rate Matters
Payment recovery rate shows how much revenue is recovered after payment failures. When recovery is high, more payments go through, and fewer subscriptions are interrupted.
When recovery is low, failed payments remain unresolved.
This leads to several problems, like
- Revenue is lost because those payments are not collected.
- Subscriptions may stop after repeated failures, leading to involuntary churn.
- Teams spend extra time retrying payments and contacting customers.
How to Improve Payment Recovery Rate
Teams must focus on resolving failed payments to increase the payment recovery rate. One common approach is dunning management, which includes:
- retrying payments automatically.
- sending reminders to update payment methods.
- making it easy for customers to fix payment issues.
Track this metric along with your other SaaS metrics to spot payment issues early and fix them before they affect your revenue.
Days Sales Outstanding (DSO)
Days Sales Outstanding (DSO) shows the average time a business takes to receive payment after making a credit sale. In simple terms, it reflects how long invoices stay unpaid before the money comes in.
In SaaS businesses, customers usually pay after a billing cycle rather than immediately. As a result, tracking days' sales outstanding shows how long payments remain pending and how this impacts cash flow over time.
The formula to calculate DSO is simple.
DSO = (Average Accounts Receivable ÷ Credit Sales) × Number of Days.
To calculate DSO, begin with the average accounts receivable for the period. Compare it to total credit sales, & then apply the number of days to determine the final DSO value.
For example,
Average accounts receivable: $50,000.
Credit sales: $150,000.
Period: 30 days
DSO = 10 days.
It shows that businesses take an average of 10 days to collect payments.
Note: DSO only includes credit sales, not cash sales. Since cash payments are received immediately, they are not part of accounts receivable and are therefore left out of the calculation.
Why Days Sales Outstanding Matters
DSO, or Days Sales Outstanding, helps teams track the collection period and identify delays in payment collection.
A rising DSO can highlight problems such as
- Delayed customer payments.
- Weak collection processes.
- Potential cash flow issues.
A low DSO indicates
- Customers pay quickly.
- Cash is collected faster.
DSO in SaaS Metrics
In SaaS, teams track DSO to understand how long it takes to collect payments. It helps identify delays and improve the collection process, which can lead to faster revenue recognition and enhanced financial stability for the company.
Many companies use billing and accounts receivable systems to track DSO and manage collections more effectively. Improving DSO helps reduce delays, collect payments faster, and keep cash flow steady.
Refund Rate
The Refund rate measures the percentage of revenue returned to customers after payments are completed. It shows how much of your total sales are refunded within a specific period.
In SaaS, refunds usually occur after subscription payments. Mainly due to billing errors or early cancellations. Monitoring refund rates helps teams understand how often these issues occur and what factors are causing them.
The formula to calculate the refund rate is,
Refund Rate = (Total Refund Amount ÷ Total Sales Revenue) × 100
For example,
If the total revenue is $50,000,
& refunds issued are $2,500
then,
Refund Rate = 5%
This means the company refunded 5% of its total revenue.
Why Refund Rate Matters
Refund rate shows how often customers request their money back after payment. A higher rate points to issues with pricing, product experience, or billing.
When refund rates increase:
- Revenue decreases as payments are returned.
- Customer retention becomes harder as more customers request refunds.
- Billing errors may occur, such as incorrect charges or duplicate invoices.
The refund rate is connected to payment failures, subscription refunds, and customer churn. Failed payments stop revenue from coming in, while refunds return revenue that was already collected.
Why Refund Rate Matters in a SaaS Dashboard
Teams track refund rates to see how often revenue is returned and where refunds come from. When refunds increase, it usually points to issues in pricing, billing, or product experience. Teams use this metric to find the cause and fix it.
Keeping refunds low helps:
- In retaining customers.
- Prevent revenue loss.
- Maintaining a stable subscription business.
Subscription Movement Metrics
These metrics track changes in subscription status and lifecycle activity, including renewals and overall subscription volume
Active Subscriptions
Active subscriptions are customers who have a valid, paid, and ongoing plan with a business. In simple terms, these are customers who are currently paying and contributing to recurring revenue. A subscription is considered “active” when it is live, billed & not cancelled or expired.
Why Active Subscriptions Matter and Their Role in Subscription Lifecycle?
In subscription management, active subscriptions are one of the key metrics. It directly indicates the health of a SaaS (Software as a Service) business and its recurring revenue stream. An increasing number of active subscriptions means strong customer retention.
Tracking this metric is helpful for businesses. With this, businesses can understand how many customers are currently engaged & paying. This is necessary for predicting revenue & planning growth.
Active subscriptions are a key phase in the subscription lifecycle. During this phase, users have to sign up, start using the product, & later decide whether to renew or cancel their subscription. Managing this lifecycle effectively ensures users remain active for longer periods.
Modern subscription management software like Saaslogic automates billing, renewals, & upgrades. Thus, ensuring subscriptions run smoothly without manual effort
Impact of Active Subscriptions in Churn
Active subscriptions play a key role in managing churn. Usually, customer loss occurs when customers cancel or fail to renew their subscriptions.
By monitoring active subscriptions along with churn rate, businesses can find risks early. This includes declining engagement or failed payments. Thus, helping businesses take necessary action to avoid customer loss.
Active subscriptions are the backbone of any subscription business. Using right subscription management tools & analytics is beneficial for companies. It helps companies reduce the number of customers leaving. Additionally, companies can improve retention & increase long-term recurring revenue.
Expiring Subscriptions
Expiring subscriptions is a key phase in the subscription process. If this phase is not managed properly, it will result in customer loss. This is mainly due to non-renewals.
Why are Expiring Subscriptions Important?
In subscription businesses, the shift from active to expired status is a key moment. It impacts revenue & retention. If a subscription is not renewed after expiry, it is counted as churn and impacts recurring revenue. Not only this, but it also affects core SaaS metrics like Monthly Recurring Revenue (MRR) and Customer Lifetime Value (CLV).
Tracking expiring subscriptions helps businesses find at-risk customers early. This helps in taking preventive actions such as reminders, plan adjustments, or incentives.
Role of Subscription Expiration Tracking
Modern subscription management software consists of subscription expiration tracking. This is to monitor upcoming renewals in real time.
It ensures:
- Timely renewal notifications
- Automated billing retries
- Reduced revenue leakage
This tracking is often integrated with subscription analytics. Thus, providing insights into renewal rates, payment failures, & customer behavior patterns. With these insights, companies can understand when & why users fail to renew.
Expiring subscriptions are deeply connected to a broader subscription lifecycle. By combining subscription expiration tracking, dunning, & predictive analytics, businesses can turn expiring subscriptions into renewal opportunities & improve long-term retention.
Product Dashboard
Product dashboards track user behavior, engagement quality, feature usage, and product adoption trends.
User Activity Metrics
User activity metrics show how many people are actively using your product within a given time. For SaaS businesses, these are not just engagement numbers; they are direct signals of product health, subscription value, and early churn risk.
While billing metrics like MRR and NRR tell you how revenue is moving, user activity metrics tell you why. A decline in active users is often an early signal of falling renewals. When customers stop engaging with your product, they stop seeing value in their subscription billing, and that is when churn begins.
A SaaS dashboard typically tracks active users across three timeframes:
Daily Active Users (DAU): The number of unique users active in a day.
Weekly Active Users (WAU): The number of unique users active over 7 days.
Monthly Active Users (MAU): The number of users active in a month. Often used for products with longer usage cycles, such as analytics, reporting, or subscription billing platforms.
How to Calculate User Activity Metrics
Tracking all three timeframes together gives product and customer success teams a complete view of engagement across different usage patterns. One key ratio derived from these metrics is the DAU/MAU Stickiness Ratio:
Stickiness Ratio = (DAU ÷ MAU) × 100
For example,
If your product has 600 daily active users and 3,000 monthly active users,.
then,
Stickiness ratio: 600 ÷ 3000 × 100 = 20%.
A stickiness ratio of 20% or above is generally considered healthy for SaaS products. It indicates that users return regularly and engage consistently with the product.
It is important to define what counts as an "active" user beyond just a login. Meaningful actions such as completing a task, generating a report, or updating a subscription give these SaaS metrics the depth needed to drive real retention decision
Why User Activity Metrics Matter in a SaaS Dashboard
User activity metrics reveal product engagement before it impacts revenue. A decline in daily active users, weekly active users, or monthly active users is often the earliest churn signal, appearing weeks before it shows up in subscription billing data.
Early churn signal
A drop in active users often happens before cancellations. This gives teams time to step in, re-engage users, and prevent churn.
Validates Subscription Value
Customers continuously evaluate whether your product is worth paying for. Low usage, even from paying customers, signals a gap that will eventually surface as a cancellation or downgrade in your subscription billing data.
Connects Usage to Revenue Metrics
Engaged users are far more likely to upgrade their plans. A decline in daily active users across a customer segment frequently correlates with rising contraction MRR or increased churn rate in the same cohort.
Tracks Product Health Over Time
Tracking DAU, WAU, and MAU consistently creates a behavioral baseline for your product. This makes it easier to spot trends such as onboarding drop-offs, feature adoption changes, or seasonal shifts.
By tracking user activity metrics consistently, teams can understand user behavior, improve retention, and build a more stable SaaS product over time.
Engagement Quality Metric
These metrics measure the depth of product usage, not just logins
Session Duration
Session duration is the total time a user spends actively engaging with your product during a single session. A session begins when a user logs in or out of the product or becomes inactive (typically after 30 minutes of inactivity).
Unlike active user counts, session duration in SaaS captures the quality of each visit. In a DAU (Daily Active Users) report, a user who logs in for 30 seconds is counted the same as one who spends 20 minutes completing core workflows. Session duration helps distinguish between these two types of engagement.
The formula for calculating session duration is:
“Average Session Duration = Total Time Spent Across All Sessions ÷ Total Number of Sessions.”
For example, if your product records a total of 1,000 sessions that amount to 8,000 minutes in a month,
Then, Average Session Duration = 8,000 ÷ 1,000 = 8 minutes per session.
Session duration on its own does not explain how users interact with your product. To understand engagement better, it should be viewed alongside these related metrics.
Sessions Per User (How many times a user comes back and uses your product).
Actions Per Session (The number of meaningful interactions completed per visit).
Core Feature Usage Depth (How deeply users are using your main/important features).
Why Session Duration Matters in a SaaS Dashboard
Session duration is a direct signal of whether users are getting real value from your product during each visit. Consistently short sessions, especially from paying customers, often indicate friction in workflows, poor onboarding, or low feature adoption, all of which are early signals of churn risk.
When session duration declines across a customer cohort, it often leads to a drop in retention rate.
Analyzing session duration alongside active user metrics and churn rate provides product and customer success teams with the context needed to proactively address disengagement before it results in churn.
Feature Adoption Metrics
These metrics show whether users are actually using the key product features.
Feature Adoption Rate
Feature adoption rate in SaaS refers to the percentage of users who actively use a specific feature in a product over a given time. With this metric, businesses understand how well existing or new features are being received. Not only this, but it will also help you know whether the features deliver real value to customers
Why is Feature Adoption Rate Important?
In SaaS subscription management, launching features simply is not enough. Driving usage is what impacts retention & revenue. A low feature adoption rate may show poor onboarding, lack of knowledge, or misalignment with customer needs.
On the other hand, a high feature adoption rate in SaaS indicates that users are more engaged with the product. This, as a result, increases stickiness & reduces churn.
The formula to measure feature adoption rate is:
Feature Adoption Rate (%) = Number of users who used the feature / Total number of active users x 100
This is one of the important feature usage metrics for product & growth teams.
For example,
In platforms focused on subscription billing, tracking adoption of certain features would be beneficial. This can help you identify how effectively customers are using the systems. The features are automated invoicing, usage-based pricing, or dunning management.
How to Improve Feature Adoption
Improving feature adoption rate in SaaS requires a combination of several processes. This consists of onboarding, in-app guidance, & continuous user education. Highlighting key features during the user journey & aligning them with customer goals can improve engagement.
Moreover, analyzing how customers use your features can show you exactly where they’re dropping off & what needs to be fixed. When users clearly know the value of each feature, adoption naturally increases. This makes your overall SaaS subscription management stronger.
Time to First Key Action
Time to first key action (TTFA) is also known as “time to first action." It is a key onboarding metric in SaaS subscription management. With this metric, you can measure the time taken by a new user to do their first action after signing up. It consists of creating a subscription plan, configuring billing, or generating the first invoice. Moreover, this metric directly reflects the time taken by the users to understand & engage with your product’s core value.
Why Time to First Action Matters
In product feature metrics & customer success metrics SaaS, TTFA is a key aspect of activation & retention. When users finish their first process faster, they experience value sooner. Thus, improving continued usage and reducing early drop-offs.
In subscription platforms, delays in taking the first action slow adoption and push revenue further out. TTFA helps you find out exactly where users struggle during onboarding, helping to fix the problem fast. This enables teams to optimize workflows and simplify the user journey.
The formula to measure “Time to First Action” is:
Time to First Action = Time of First Key Action – Time of Sign-Up
When this metric is analyzed along with the activation rate & feature adoption, this metric becomes more powerful. This is because it highlights both the speed & depth of engagement.
How to Reduce Time to First Action SaaS
For this purpose, first focus on removing onboarding friction. Simplify the initial setup, guide users with in-app prompts, & focus mainly on steps that lead to value. Moreover, clear calls-to-action, pre-built templates, & contextual onboarding flows can speed up first actions.
Optimizing time to first action makes sure that the users quickly experience value. Thus, setting the base for long-term engagement & growth.
Customer Journey Metrics
These metrics track how users move through the product lifecycle
Onboarding Completion Rate
Onboarding completion rate shows the percentage of new users who complete every step of the onboarding process. For SaaS companies, a strong onboarding experience directly boosts retention, product adoption, and long-term subscription value, making it one of the most important SaaS customer journey metrics to track.
How to Calculate Onboarding Completion Rate
Onboarding Completion Rate = Users Who Completed Onboarding ÷ Users Who Started Onboarding × 100.
For example, if 800 users start onboarding and 600 complete it, then
the onboarding completion rate = 600 ÷ 800 × 100 = 75%.
Why Users Drop Off During Onboarding
Users don’t abandon onboarding randomly; it usually comes down to specific, fixable issues. Common reasons include too many steps, unclear instructions, slow time to first value, or a mismatch between expectations and the actual product experience.
This is where onboarding analytics becomes critical. Instead of just showing that users drop off, it helps you identify exactly where they drop off. Thus, helping you fix the friction points that matter most.
Why Onboarding Completion Rate Matters in a SaaS Dashboard
Users who abandon onboarding rarely reach activation. They never experience core product value, and they churn early.
Every incomplete onboarding also represents lost customer acquisition cost (CAC). Your team spent money bringing that user to the product. A poor onboarding experience prevents any return on that investment.
Connecting onboarding completion rate to downstream metrics like churn rate, NRR, and CLV transforms it from a product team concern into a revenue signal. It tells you what is going wrong at the start of the customer journey before it shows up in your billing data.
Activation rate
Activation rate in SaaS measures the percentage of new users who reach the point where they take a key action and start seeing real value in your product.
This is the moment when a user moves beyond just signing up and begins actually using the product. Until then, they’re just exploring. After that, they have a reason to stay.
What counts as this “value moment” depends on the product. For a project management tool, it might be when a user completes their first task. The action varies, but activation always means the user has achieved a real outcome using your product.
How to Calculate User Activation Rate
Activation Rate = (Users Who Completed Activation Steps ÷ Total New Signups) × 100.
For example, if 1,000 users sign up in a month and 350 reach the defined activation point.
Then the Activation Rate = 350 ÷ 1000 × 100 = 35%.
Top-performing product-led growth companies typically target activation rates between 20% and 40%.
How to Improve User Activation Rate
Shorten the path to value. Every unnecessary step between signup and the first value moment reduces completion. Cut friction early.
Personalize the onboarding flow. Users with different goals need different paths. A single generic flow misses most of them.
Trigger contextual prompts. Guide users toward activation with in-product cues at the right moment. Instead of sending generic emails later.
Why Activation Rate Matters in a SaaS Dashboard
A user who never activates generates no revenue but still incurs your full customer acquisition cost. Low activation rate becomes a silent CAC leak that compounds as acquisition scales.
Activated users retain longer, expand their subscriptions more often, and churn at lower rates. Tracking activation rate in your SaaS dashboard tells your product and growth teams whether new users are moving toward long-term value or dropping off before they ever get there.
Time to Value
Time to Value (TTV) measures the time between a user signing up and the moment they get a real result from your product. Where activation rate tells you whether users reach value, TTV tells you how quickly they get there. Together, they map the full picture of early customer experience.
In SaaS, customers expect results fast. The longer TTV stretches, the higher the risk of early churn, most of it silent, happening before a customer ever raises a complaint or cancels formally.
How to Calculate Time to Value
TTV= Date of First Value Achievement-Date of Signup
TTV has no universal benchmark because every product defines value differently. What matters is tracking it consistently, segmenting by plan type or user persona, and reducing it over time.
Types of Time to Value
Not all TTV is the same. SaaS products typically fall into one of these patterns:
Immediate TTV — Value starts the moment the customer uses the product. Common in simple, single-purpose tools.
Short TTV — Customers reach value within hours or a few days, usually after minimal onboarding.
Long TTV — Value takes weeks or longer to realize, typically in complex enterprise products requiring deep integration or training.
Knowing which type applies to your product shapes how you design onboarding, customer success, and retention strategy.
Why Time to Value Matters in a SaaS Dashboard
Most users who disengage early never complain. They simply stop coming back, and TTV data is often the only metric that catches that pattern early enough to act on.
A long TTV means users spend more time figuring things out instead of getting value. That gap is where early churn lives. Users who reach value faster activate at higher rates, retain longer, and are more likely to expand their subscriptions.
Tracking TTV alongside activation rate and onboarding completion rate gives your product and customer success teams a connected view of where users slow down and where to step in before disengagement shows up in your churn and revenue metrics.
Trial-to-Paid Conversion Rate
Trial-to-paid conversion rate measures the percentage of free trial users who convert to a paid subscription within a defined period. It marks the final stage in the customer journey, where a user either converts to a paid plan or exits without subscribing.
All previous metrics influence whether a user converts. Effective onboarding, faster time to value, and high activation all lead to one outcome: a user deciding to upgrade from the free trial to a paid plan.
This metric is important for businesses using a freemium or trial-led approach, where conversion is driven by product experience rather than sales outreach. Users decide to pay based on how quickly they reach activation and realize real value.
The formula to calculate the trial-to-paid conversion rate is:
Trial to Paid Conversion Rate = (Trial Users Who Converted to Paid ÷ Total Trial Users) × 100.
For example, 1500 users start a free trial in a month and 150 convert, then the conversion rate is 10%.
Why Trial-to-Paid Conversion Rate Matters in a SaaS Dashboard
A low conversion rate usually means something is not working before the payment step. Users sign up, but the product does not give them enough reason to continue.
The real insight comes from users who do not convert. Their behavior shows where the experience falls short. In many cases, users drop off before completing onboarding, never reach activation, or disengage after the first few sessions.
Monitoring this rate helps you connect user behavior directly to revenue. A drop in conversions almost always traces back to an earlier stage: onboarding, activation, or time to value, where the experience failed to hold the user.
Product Led Retention Signals
A product-led retention signal is an early indicator, based on user behavior inside your product, that shows whether a user is likely to retain or churn. These signals exist because most outcome metrics, churn rate, revenue loss, cancellations, only confirm what has already happened. Retention signals tell you what is about to happen.
Common product-led retention signals include usage drop-off, inactive user trends, and product-qualified leads. Together, they give teams a connected view of engagement health, churn risk, and conversion potential.
Usage Drop-Off Signals
Usage drop-off shows where users disengage during key workflows like onboarding or feature adoption. It helps uncover friction points that affect both product experience and overall product health.
Drop-off does not happen randomly. It typically occurs where value is unclear, delayed, or too difficult to reach.
How to Calculate Usage Drop-Off Rate
Drop-Off Rate = (Users at Step A - Users at Step B )/ (Users at Step A) ×100.
For example, if 1,000 users start onboarding and 520 complete it, the drop-off rate is 48%.
Monitoring usage drop-off as part of SaaS product usage metrics and subscription usage analytics helps teams reduce SaaS churn. With AI in subscription management, these patterns can also be identified earlier and addressed proactively.
Inactive User Trends
Inactive user trends show how engagement changes over time and identify when users go dormant. Inactivity is defined using time-based thresholds rather than a single formula. What counts as inactive depends entirely on your product's expected usage rhythm.
How to Calculate Inactive User Rate
Inactive User Rate=Inactive Users / Total Users ×100
For example, if 2,000 users are active in a month and 400 show no activity for 30 days, the inactive user rate is 20%.
Dormant user tracking in SaaS is most valuable when acted on early. A user inactive for 14 days is far easier to re-engage than one inactive for 60. Building dormant account reactivation workflows triggered by inactivity thresholds turns a passive metric into an active retention lever.
Product Qualified Leads (PQLs)
Product qualified leads are users who have shown meaningful engagement inside your product and are more likely to convert to paying customers. High usage alone does not signal buying intent. What matters is whether users reach moments of real value.
PQLs in SaaS are defined based on behavioral thresholds specific to your product, such as:
- Repeated use of a core feature.
- Completing onboarding.
- Reaching a key value milestone.
How to Define and Measure PQLs
There is no universal formula. PQLs are identified based on product specific conditions.
PQL Rate= (PQL Users / Total Trial Users) ×100.
For example, if 500 users sign up and 100 meet your PQL criteria, the PQL rate is 20%.
As a product-led growth metric in SaaS, PQLs connect product usage directly to revenue potential. They shift your sales and customer success teams away from cold outreach toward users who have already demonstrated intent through product behavior, making conversion efforts faster and more precise.